I Tested 45 Safelists: Which Ones Sent Visitors Who Actually Paid Attention?

45 safelists tested to determine which visitors deliberately paid attention.

Hello!

For the first half of July, I sent the same unusual page through 45 different safelists.

It wasn’t a sales page.

There was no product to buy, no form to fill out, and no promise of making money.

Instead, the page told visitors that they had become part of a safelist experiment and asked them to click one simple button:

“Yes… I Noticed This Page”

Safelist attention experiment page with the “Yes, I Noticed This Page” button.
The page used for the Safelist Attention Project. Visitors were asked to confirm that they had deliberately noticed it.

That was the entire point of the test.

I wasn’t simply trying to find out which safelists could generate the most page loads. I wanted to know which ones sent visitors who were present enough to notice what was in front of them and deliberately respond.

After 8,433 visits, the experiment recorded 389 confirmed submissions.

I expected the safelists that sent the most traffic to produce the most attention.

That isn’t what happened.

The results showed something I have suspected for a long time:

Traffic and attention are not the same thing.

A traffic counter can tell us that a page loaded. It cannot tell us whether the person on the other side actually noticed it.

That is what the Safelist Attention Project was designed to explore.

Why I Ran the Safelist Attention Project

I have been using safelists for more than 20 years.

During that time, I have published plenty of safelist rankings and traffic reports. Those reports can be useful. They show which sites are active, how much traffic they send, and sometimes which ones produce sign-ups or sales.

My Best Safelist Rankings for 2025 followed that more traditional approach.

The problem is that a normal traffic counter can only tell me that a page loaded.

It cannot tell me whether anybody was mentally present.

The page may have opened in a background tab. Someone may have been clicking through several messages at once. The visitor may have waited for a timer, collected a reward, and moved on without really processing the page.

That does not necessarily mean the visit had no value.

Repeated visibility, branding, familiarity, and future recognition can all matter. Someone may notice an offer today and respond to it weeks later.

But I wanted to measure something more deliberate.

Earlier this year, I ran a very simple safelist experiment that asked visitors to click a button simply to show that they had participated.

The response made me curious about what else this kind of test might reveal.

This time, instead of looking only at the experiment as a whole, I wanted to compare the safelists themselves.

Which sites would send the most traffic?

Which would produce the highest percentage of deliberate interactions?

Would the same platforms lead both lists?

What Counted as Attention?

I used the same email, landing page, button, and tracking rules for every safelist.

The source code in the URL was the only intentional campaign difference.

The page did not sell anything.

There was no opt-in form, payment button, affiliate offer, or long sales presentation.

Visitors were told that they had become part of an experiment. The main action on the page was the button:

“Yes… I Noticed This Page”

Clicking that button was what I counted as an attention click.

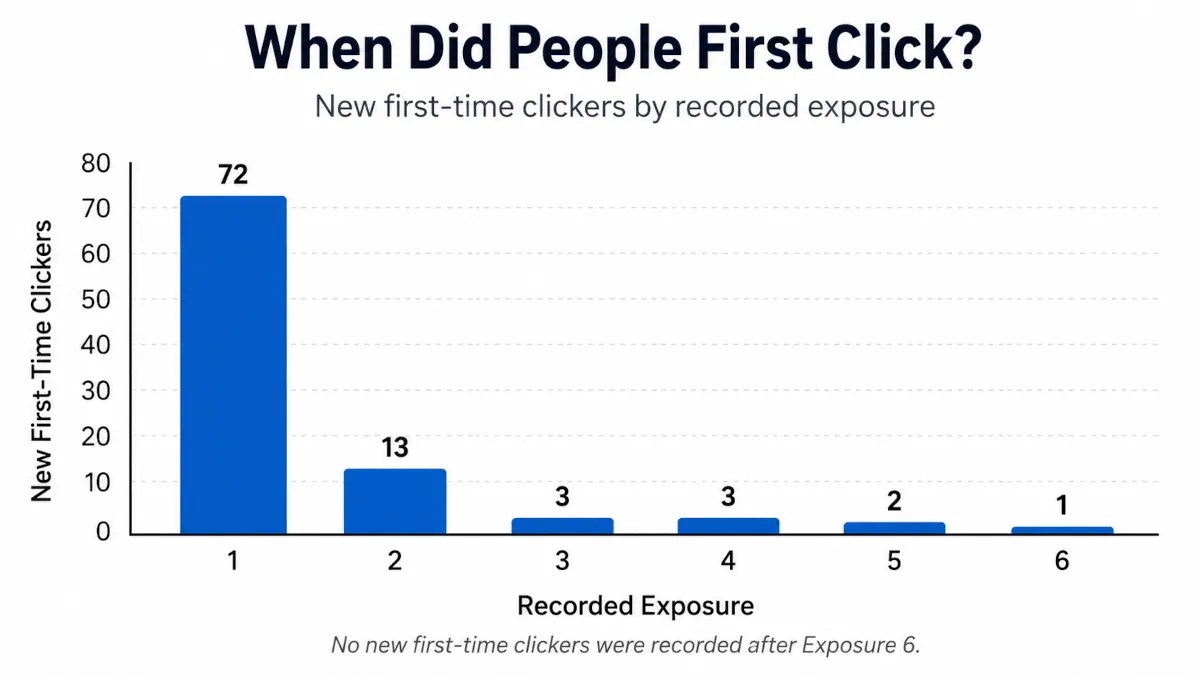
After clicking, visitors were asked what had made them notice the page. That gave me a second layer of information that I will explore in another article.

Each safelist received its own tracking code. The system recorded the source, visit, visitor ID, session, timestamp, click, and follow-up answer.

A new visit was recorded each time the page loaded. Refreshing the page created another visit.

A persistent browser cookie was used to recognize returning visitors. That allowed me to separate total clicks from distinct tracked visitors who clicked.

This distinction is important:

Total clicks measure deliberate interactions.

Unique clickers measure how many distinct tracked browsers or visitor IDs interacted.

The unique counts do not guarantee that every ID represents a different physical person. Someone using two devices could receive two IDs. Two people sharing a browser could share one.

Still, it gives us a much better view than treating every page load as a completely different person.

I also chose not to use time on page as the main signal.

A safelist page can remain open while someone is doing something else. A deliberate button click is not perfect proof of deep concentration, but it does show that the visitor saw enough of the page to understand the request and respond.

This was a structured real-world marketing experiment, not a laboratory-controlled scientific study.

The goal was to create a consistent comparison under normal safelist advertising conditions.

The Experiment by the Numbers

From July 1 through July 15, 2026, I logged 391 submission records across 45 safelists.

The experiment recorded 8,433 raw page visits.

Here is the overall picture:

MeasurementResult
Safelists with confirmed sends45
Confirmed submissions389
Raw recorded visits8,433
Final analyzed visits8,392
Distinct tracked visitors7,380
Attention clicks143
Distinct tracked clickers94
Follow-up answers105
Overall attention rate1.70%

In other words, 1.70% of the analyzed visits produced a deliberate click on the attention button.

That percentage may look small, but remember what was being measured.

These were not ordinary clicks from an email to a website.

Everyone included in the visit count had already opened the email and reached the experiment page. The button measured whether they noticed and deliberately interacted with what they found there.

The Safelists That Stood Out

I used a minimum of 100 final analyzed visits for the main leaderboard.

The table below shows the qualifying platforms that stood out most clearly during this experiment.

The “Clicks” column shows total deliberate interactions. The number in parentheses shows distinct tracked clickers.

RankSafelistVisitsClicks (Unique)Attention Rate
1Send Circle17432 (20)18.39%
2Zodiac Mailer1278 (2)6.30%
3My Daily Mailer1,00530 (19)2.99%
4Click Leverage34210 (8)2.92%
5List Avail1043 (3)2.88%
6Fast List Mailer2385 (4)2.10%
7Mister Safelist66814 (14)2.10%

Send Circle Was the Clear Attention Winner

Send Circle’s result was in a category of its own.

It produced:

  • 174 analyzed visits
  • 32 attention clicks
  • 20 distinct tracked clickers
  • an 18.39% attention rate

Send Circle provided only about 2.1% of all analyzed visits, but it produced approximately 22.4% of all attention clicks.

That is a large difference.

It also was not a case of one visitor repeatedly clicking and inflating the total.

Fifteen of Send Circle’s tracked clickers clicked once.

Five returned and clicked during additional visits. Those five repeat visitors produced 17 clicks between them, but no single visitor clicked more than five times.

Repeat engagement contributed to the result, but the response was spread across enough different visitors to make it meaningful.

Under this particular experiment, Send Circle was the unmistakable attention leader.

That does not mean it will outperform every safelist with every offer.

It means its visitors responded exceptionally well to this email, page, and request during this test.

My Daily Mailer Combined Reach With Attention

My Daily Mailer produced one of the best combinations of traffic volume and deliberate interaction.

It sent 1,005 analyzed visits, making it one of the largest traffic sources in the experiment.

Those visits produced:

  • 30 attention clicks
  • 19 distinct tracked clickers
  • a 2.99% attention rate

My Daily Mailer generated almost as many total attention clicks as Send Circle while working with a much larger audience.

Its percentage was nowhere near Send Circle’s, but that is exactly why volume and rate need to be viewed together.

A high response rate from a modest traffic source and a solid response rate from a high-volume source are two different kinds of success.

My Daily Mailer showed that it could deliver substantial reach without losing the ability to generate deliberate interaction.

Full disclosure: I own My Daily Mailer and Mister Safelist. Members of those sites may already be familiar with me, my writing, or the way my pages look, and that familiarity could have influenced how quickly they recognized and interacted with the experiment.

I included both sites because they were part of the same tracked test, but that possible familiarity effect is worth keeping in mind when reading the results.

Click Leverage Was a Strong Independent Performer

Click Leverage delivered 342 analyzed visits and produced 10 attention clicks from eight distinct tracked visitors.

Its attention rate was 2.92%.

That placed it very close to My Daily Mailer and List Avail on a per-visit basis.

It delivered a healthy sample, a competitive attention rate, and clicks spread across several different tracked visitors.

I would consider it one of the strongest all-around independent performers in the experiment.

Mister Safelist Produced Broad Unique Attention

Mister Safelist generated 14 attention clicks from 668 analyzed visits.

Its 2.10% rate looks modest next to Send Circle, but there is something important inside that number:

All 14 clicks came from different tracked visitors.

There were no repeat clickers driving Mister Safelist’s total.

My Daily Mailer produced more total attention, while Mister Safelist spread its attention across a broader set of unique visitors without relying on repeat participation.

Again, these are different kinds of performance.

One platform generated more total interaction.

The other provided a very clean example of broad unique response.

Zodiac Mailer Shows Why Unique Clickers Matter

Zodiac Mailer had the second-highest raw attention rate in the table:

  • 127 analyzed visits
  • 8 attention clicks
  • 2 distinct tracked clickers
  • a 6.30% attention rate

At first glance, that percentage looks like a clear second-place finish.

The unique-clicker count changes the interpretation.

All eight clicks came from two tracked visitors. One of them clicked during six separate visits.

I do not think that result should be hidden or disqualified.

The original measurement counted legitimate attention clicks per visit, and those visitors repeatedly noticed and interacted with the experiment.

That is real repeat engagement.

It is simply not the same thing as receiving eight clicks from eight different visitors.

The positive interpretation is that Zodiac Mailer produced unusually strong repeat attention from a small number of highly responsive people.

More data would be needed before concluding that the result represents its wider audience.

List Avail and Fast List Mailer

List Avail just cleared the 100-visit qualification threshold with 104 analyzed visits.

It produced three clicks from three different tracked visitors, giving it a 2.88% attention rate.

That is a promising result, although the smaller sample means that a few additional visits or clicks could change the percentage quickly.

Fast List Mailer delivered a larger sample of 238 visits and generated five clicks from four tracked visitors.

Its exact attention rate was 2.1008%.

Neither platform should be overinterpreted from one experiment, but both earned a place among the more interesting results.

There Was More Than One Way to Perform Well

This experiment did not produce one universal definition of “best.”

It revealed several different strengths:

Send Circle: Highest attention rate and strongest overall response

My Daily Mailer: Strong combination of high volume and substantial attention

Click Leverage: Strong independent balance of sample size and response

Mister Safelist: Broad unique attention with no repeat clickers

Zodiac Mailer: Strong repeat engagement from a small responsive group

List Avail: Promising attention rate at the qualification threshold

A normal traffic ranking would mostly reward the platforms that delivered the most page loads.

An attention ranking tells a different story.

The biggest traffic source does not automatically produce the highest response rate.

The highest response rate does not automatically represent the broadest audience.

The platform with the most unique clickers does not necessarily produce the most total interactions.

Each measurement describes something slightly different.

What the Rankings Really Show

The central lesson is not that traffic volume is unimportant.

Without traffic, there is nobody available to notice the page.

The lesson is that traffic and attention are not interchangeable.

One safelist can send a large audience and create valuable reach.

Another can send fewer visitors but have a higher percentage of them deliberately engage.

A third may create repeated exposure that causes the same visitors to notice the message more than once.

That is why I have become less interested in traffic numbers by themselves.

As I wrote in Most People Don’t Need More Traffic, traffic often acts as an amplifier.

Sending more visitors does not automatically fix a page or message that people ignore.

The way an idea is presented still matters.

The same audience can react very differently to a different headline, image, email, or call to action.

The Safelist Attention Project gives us another way to look at that problem.

It does not just ask:

“How many visitors arrived?”

It asks:

“How many were present enough to respond?”

What Made People Notice the Page?

After visitors clicked the attention button, I asked them what had caught their attention.

There were 105 recorded answers.

The eyes image was the most frequently selected response, followed by the overall page design and the headline.

That is interesting, but it needs its own article.

Repeat visitors could answer during more than one visit, so the total answers and the number of distinct respondents are not the same.

I will examine that part of the experiment separately rather than squeezing a second study into this report.

For now, the important point is that the page itself mattered.

The safelist delivered the visitor, but the message and design still had to earn the interaction.

What These Rankings Do Not Prove

This experiment measured one specific kind of deliberate interaction.

It did not measure:

  • sales
  • opt-ins
  • long-term customer value
  • affiliate referrals
  • brand recognition over time
  • whether someone returned days later through another route

The results also apply to one subject line, one email, one landing page, one visual approach, one call to action, and one period in July 2026.

A different offer could produce a different ranking.

I also used my existing safelist accounts.

Those accounts did not all have identical membership levels, mailing intervals, or potential audience reach. That affects how much traffic each safelist could deliver.

The attention-rate comparison helps separate interaction quality from raw volume, but differences in membership privileges and audience composition still matter.

Small samples can also create unstable percentages, which is why I required at least 100 final analyzed visits for the main table.

Finally, a platform that did not stand out under this particular experiment may still provide value through reach, repetition, branding, delivery speed, or better performance with a different type of offer.

This is not a list of good safelists and bad safelists.

It is a record of what happened when I asked 45 safelists to send visitors to the same attention test.

Safelist Traffic Kept Arriving After I Stopped Mailing

My final confirmed submission was sent on July 15.

I left the experiment open so I could see how long traffic continued to arrive.

A full week later, on July 22, the page still received 22 human-likely visits after identifiable automated activity was removed.

Two of those visitors clicked the attention button.

One came through Send Circle.

The other came through List Avail.

That means the final day was not simply crawler traffic or leftover technical checks.

Real visits and deliberate interaction were still happening seven days after the last mailing.

I will look more closely at the delayed traffic in another article because it raises an interesting question:

How long does a safelist mailing continue producing exposure after it leaves the newest-message area?

Final Thoughts

I started this experiment expecting the largest traffic sources to dominate.

Instead, Send Circle delivered the clearest example of why traffic volume and attention quality need to be measured separately.

My Daily Mailer showed the value of combining reach with response.

Click Leverage delivered a strong independent result.

Mister Safelist demonstrated broad unique participation.

Zodiac Mailer showed how repeat engagement can create a very different kind of attention.

No single number tells the entire story.

That may be the most useful finding of all.

This experiment did not prove which safelist is universally the best.

It showed which platforms stood out when all 45 were asked to send visitors to the same page using the same email, button, and tracking rules.

There is still plenty left to examine.

In the next parts of this series, I will look more closely at traffic volume versus attention, what visitors said made them notice the page, repeat participation, how long safelist traffic continues after mailing stops, and the differences between My Daily Mailer and Mister Safelist.

In the meantime, I would like to hear from you.

Do these results match what you have seen in your own safelist advertising—and what would you like me to test next?

Thanks for reading,

Jerry

P.S. If you are working on your own safelist campaigns, the most important thing you can do is track more than raw hits. My free Safelist Marketing Tactics guide explains the practical side of creating, testing, and improving your campaigns.

What Makes People Stop and Notice an Ad?

Glowing light bulb standing out from dark bulbs representing fresh advertising ideas

One thing I’ve noticed over the years while studying what makes people notice an ad is that a lot of marketers keep running the exact same ads for way too long.

Same headline.
Same image.
Same colors.
Same wording.

Day after day after day.

And after awhile, people stop noticing them.

Not because the ads are terrible. Not because the offer suddenly became bad.

But because the ad has become familiar.

I was thinking about this recently while browsing through safelists and traffic exchanges.

You start seeing the same marketers promoting the same things over and over again. Eventually some of those ads almost stop feeling like ads entirely.

They become part of the background.

Your brain already knows what it’s looking at before you even consciously process it. Your eyes just slide past automatically.

Then somebody changes something.

Maybe it’s a completely different image.
Maybe it’s a strange headline.
Maybe the ad suddenly has a different tone or feel from everything around it.

And immediately it stands out.

Not necessarily because it’s better.

Just because it feels different.

Familiarity Can Kill Attention

I think this happens much faster than most marketers realize, especially in environments where people are constantly scanning ads all day long.

Eventually even good ads lose their ability to interrupt attention.

And attention is really the first battle.

Because if nobody stops long enough to notice your ad, nothing else matters after that.

Not the landing page.
Not the offer.
Not the product.

None of it.

Why I Change Ads So Often

A lot of the time when I change ads, there isn’t some giant marketing strategy behind it.

Honestly, it’s mostly intuition.

Sometimes I just get the feeling that people have seen the same thing too many times.

So I’ll change:

– the image
– the headline
– the colors
– the wording
– sometimes the entire vibe of the ad

Even when I’m still promoting the exact same thing.

And very often the new version immediately starts getting more attention.

Not because the previous ad failed.

Just because the new one feels fresh again.

Something Interesting I’ve Noticed

One thing I’ve learned is that old ads don’t always stay “old.”

Sometimes an ad that completely stopped working suddenly starts working again months later.

That’s especially true in safelist marketing.

New people join constantly.
Old members disappear.
Activity changes.
The audience shifts over time.

An ad that everybody ignored six months ago might suddenly feel brand new simply because most of the current audience hasn’t seen it in a long time.

That’s something I think a lot of marketers overlook.

Small Changes Can Make People Notice an Ad

A lot of times you don’t even need a completely new idea.

Sometimes all it takes is breaking the visual pattern people have gotten used to seeing.

Something slightly unexpected.
Something that interrupts the autopilot scrolling for half a second.

That moment matters.

Because once somebody actually notices your ad, curiosity finally has a chance to kick in.

Final Thoughts

One thing this has reminded me is that marketing isn’t always about creating something completely new.

Sometimes it’s simply about making something feel new again.

Or presenting the same idea from a different angle.

Because in places like safelists and traffic exchanges, familiarity can make even good ads disappear into the background after awhile.

And sometimes the marketers getting the most attention aren’t the ones with the best offers.

They’re just the ones who still know how to stand out.

Why I Still Like Safelists After All These Years

Marketer workspace with laptop, notebook, and charts representing safelist marketing strategy and planning

I’ve been using safelists for a long time.

Long enough that at some point people started calling me “the safelist guy.”

And honestly, that’s probably fair.

They’ve been part of my daily routine for years.

So every once in a while I get asked a simple question.

Do safelists still work?

The answer is yes.

But like most things in marketing, it depends.

They’re Still Part of My Routine

One of the main reasons I still use safelists is just how naturally they fit into my day.

It’s something I’ve been doing for so long that it doesn’t feel like work.

If I have something new to promote, I can sit down, send out a round of ads, and start getting traffic almost immediately.

That’s still one of the things I enjoy the most.

There aren’t many places where you can get real people looking at your page within minutes.

Safelists still give you that.

I Know the Audience

Another reason I’ve stuck with safelists is simple.

I understand the audience.

Over the years I’ve gotten a feel for what safelist users respond to and what they ignore.

And more importantly, I’ve learned to create ads that match the audience, instead of expecting the audience to match my ads.

That’s probably where a lot of people get stuck.

What Most People Get Wrong

A lot of the frustration people have with safelists comes down to a few things.

– expecting instant results
– lack of consistency
– not tracking what they’re doing
– not knowing when to change direction

But the biggest one is this:

Trying to force the wrong offer in front of the wrong audience.

Safelists have a very specific type of user.

If what you’re promoting doesn’t appeal to that type of user, it’s going to be an uphill battle no matter how well you write your ads.

What’s Changed Over Time

Safelist marketing isn’t the same as it was years ago.

More people are doing the things that actually work.

Which is good.

But it also means it’s harder to stand out.

At one point, just doing things correctly gave you an edge.

Now that’s not enough.

If anything, it’s more important than ever to be a little different.

To do something that makes people pause for a second.

That’s part of what led me to run the experiment I just shared in my last few posts.

So… Do Safelists Still Work?

Yes.

But not for everything.

If you’re promoting something that actually appeals to safelist users, they can still work very well.

If you’re not, they probably won’t.

That’s really what it comes down to.

Who Does Well With Safelists?

It’s not about working harder.

Most people in this space are already putting in the effort.

The people who tend to do the best are the ones who think a little differently.

They’re willing to experiment.

They try new ideas.

And they know how to take that creativity and apply it to their ads.

That’s where the real edge is now.

Why I Still Enjoy Using Them

At the end of the day, I still like safelists for a simple reason.

They give me a fast way to test ideas.

If I want to try something new, I don’t have to wait.

I can put it in front of real people almost instantly and see how it performs.

That’s valuable.

And it’s something I don’t take for granted.

Final Thoughts

Safelists aren’t perfect.

They never have been.

But they’re still a useful tool if you understand how to use them.

The audience matters.

The offer matters.

And more than ever, the way you present your idea matters.

That hasn’t really changed.

What My Safelist Experiment Might Actually Be Showing

Illustration of marketer discovering insights from safelist experiment data and engagement patterns

In the last two posts I shared the setup for a simple safelist experiment and then walked through the results.

The idea was straightforward.

Instead of promoting an offer or trying to build my list, I asked visitors to do something very simple.

Click a button.

No opt-in form.
No sales pitch.
No reward.

Just curiosity.

Over the course of about a week the page received 4,047 visits and 357 button clicks across 40 safelists.

The numbers themselves were interesting, but after spending some time looking through the data I started thinking about something a little deeper.

What exactly was this experiment measuring?

What This Experiment Was Really Measuring

This wasn’t a conversion test.

It wasn’t a landing page test.

And it definitely wasn’t measuring sales or signups.

What it really measured was voluntary interaction.

Someone had to:

– land on the page
– read what was written
– understand the experiment
– decide to click the button

That’s a higher bar than the normal safelist browsing process.

Which means the clicks in this experiment probably say more about attention than anything else.

Different Safelists Encourage Different Behavior

One thing became very clear while looking at the results.

Safelists don’t all behave the same way.

The same splash page ran on 40 different platforms during the same time period.

Yet the engagement levels were dramatically different.

There are probably two main reasons for that.

Community Activity

Some safelists simply have more active communities.

More members are opening mailings and browsing the ads.

That naturally leads to more interaction.

Platform Design

The structure of the mailer itself can also influence how people behave.

Some platforms make it very easy to earn credits quickly. When that happens, people tend to move through pages faster.

Other systems encourage members to spend a little more time looking at what’s on the screen.

Both factors affect how ads are experienced.

The Big Standout

One result from the experiment stood out immediately.

My Daily Mailer produced a participation rate that was dramatically higher than anything else in the test.

There are probably a few reasons for that.

The community is very active, and the platform includes Lucky Letters, which are messages that sometimes contain prizes. That naturally encourages members to actually look at the pages they land on.

It’s also possible that my ad simply stood out more there since members are already familiar with me on that platform.

Whatever the reason, the difference was noticeable.

A Couple Interesting Outliers

While reviewing the data, a couple of smaller mailers also caught my attention.

Send Circle and Viral URL didn’t send a lot of traffic during the experiment.

But the visitors they did send interacted with the page at a surprisingly high rate.

That’s always interesting to see.

Sometimes smaller communities can produce more attentive traffic simply because there are fewer members and people spend a little more time browsing the ads.

With a larger dataset it would be interesting to see if that pattern continues.

Traffic Volume vs Engagement

Another thing that stood out in the data was the relationship between traffic volume and engagement.

Some safelists sent a lot of visitors but relatively few clicks.

Others sent fewer visitors but a much higher percentage of interaction.

That doesn’t necessarily mean one type of traffic is better than the other.

It just shows that different communities interact with ads in different ways.

Why I Enjoy Running Experiments Like This

One of the reasons I enjoyed this experiment so much is that it reminded me of something I used to do regularly.

Years ago I used to publish monthly safelist statistics showing which platforms were producing the most list signups.

Those posts were always fun because they showed real data from actual campaigns.

This experiment felt a little like returning to that idea, but from a different angle.

Instead of measuring signups, I was simply measuring interaction.

And sometimes that tells us just as much.

What I Might Experiment With Next

This experiment answered some questions, but it also created a few new ones.

For example:

– Would the results change if the experiment ran longer?
– Would traffic exchanges show similar behavior?
– What would happen if the page offered an incentive instead of pure curiosity?

I may explore some of those ideas in the future.

For now, I’m glad I ran this experiment.

It turned out to be a fun way to look at safelist traffic from a slightly different perspective.

And as always, I appreciate everyone who took a moment to participate.

Safelist Experiment Results: What the Data Showed

Illustration of marketer analyzing safelist experiment results with charts and leaderboard rankings

In my last post, I explained the idea behind a small safelist experiment I decided to run.

Instead of promoting an offer or trying to build my list, I asked visitors to do something very simple.

Click a button.

There was no reward for clicking it.
No redirect.
No opt-in form.

Just a simple invitation to participate in the experiment.

The goal was to see how many visitors arriving from safelists would actually interact with the page.

Now that the experiment is finished, we can look at the numbers.

Overall Experiment Results

Over the course of about a week, I promoted the splash page on 40 different safelists.

Here are the totals.

MetricResult
Safelists Tested40
Total Visits4,047
Participation Clicks357
Overall Participation Rate8.82%

Considering there was no incentive to click the button, I thought this was pretty interesting.

The button was clicked 357 times during the experiment.

Since I didn’t track IP addresses, that number represents total clicks rather than unique participants.

Visitors were allowed to click the button once per safelist per day, so some people may have participated more than once if they saw the experiment on multiple sites.

Top Safelist Traffic Sources

First, let’s look at which safelists delivered the most visitors.

SafelistVisitsClicksCTR %
My Daily Mailer47113428.45
Mister Safelist304309.87
I Love Traffic2802810.00
State of the Art Mailer226104.42
List Impact205125.85
European Safelist202115.45
List Avail172116.40
Website Traffic Rewards15253.29
List Mailer Plus14664.11
Instant Ad Power139117.91

This shows which safelists produced the most traffic during the test.

But traffic volume is only part of the story.

Top Engagement Rates

The more interesting metric is participation rate — the percentage of visitors who actually clicked the button.

Here are some of the highest engagement rates from the experiment.

SafelistCTR %Visits
My Daily Mailer28.45%471
I Love Traffic10.00%280
Mister Safelist9.87%304
Instant Ad Power7.91%139
List Avail6.40%172
List Impact5.85%205
European Safelist5.45%202
State of the Art Mailer4.42%226

Most safelists landed somewhere between 4% and 7% participation.

That seems to be a fairly typical range for this type of interaction.

Safelists Producing the Most Participation

Another way to look at the results is by total participation clicks.

These are the safelists that generated the most actual interaction with the experiment page.

SafelistClicks
My Daily Mailer134
Mister Safelist30
I Love Traffic28
List Impact12
European Safelist11
List Avail11
Instant Ad Power11
State of the Art Mailer10

Just the top three safelists generated more than half of all participation clicks in the experiment.

The Big Outlier

One result stood out immediately when I started looking through the numbers.

My Daily Mailer

VisitsClicksCTR
47113428.45%

That participation rate was dramatically higher than anything else in the experiment.

There are probably a few reasons for this.

First, My Daily Mailer has a very active community.

Second, the platform includes “Lucky Letters” — messages that look like normal ads but sometimes contain prizes. That tends to encourage members to actually look at the pages they land on instead of just clicking through them.

And finally, it’s possible my ad simply stood out more on that platform since my picture appears on the page and members are already familiar with me there.

Whatever the reason, the difference was significant.

What the Data Suggests

One thing this experiment reinforces is something I’ve believed for a long time.

Safelists are not all the same.

Some communities are more active than others.

And the design of the platform itself can influence how members interact with ads.

Same splash page.
Same message.
Same time period.

Yet the engagement levels varied dramatically depending on the safelist.

That’s part of what makes experiments like this interesting.

Final Thoughts

I originally ran this experiment because I missed publishing safelist statistics like I used to.

It turned out to be a fun way to look at safelist traffic from a slightly different perspective.

Instead of measuring signups or conversions, this experiment simply measured curiosity.

And based on the results, there are clearly a lot of curious safelist users out there.

Thanks again to everyone who took a moment to participate.